Knowledge Hub

Sample Device Summary Table

1. Power Factor Penalty

Yes, Southern California Edison (SCE) applies power factor adjustments (penalties) to certain business customers, primarily those on industrial or large commercial rate schedules. The penalties account for inefficiencies caused by low power factor, which increases strain on the grid.


Key Details

1. Applicable Rate Schedules:

  • Penalties typically apply to General Service (GS) and Industrial (IND) rate schedules (e.g., GS-2, GS-3, IND).

  • Residential and small commercial customers (e.g., GS-1) are generally exempt.

2. Power Factor Threshold:

  • SCE often sets a minimum power factor of 0.85. If a customer’s power factor drops below this threshold, demand charges are adjusted upward.

  • Example: If the measured power factor is 0.75 (below 0.85), SCE may increase the billed demand to account for inefficiency.

3. Adjustment Formula:

  • Billed Demand = (Measured kW Demand) × (0.85 / Actual Power Factor)

  • If the actual power factor is below 0.85, this formula inflates the billed demand, raising costs.


Example Calculation

  • Measured Demand: 500 kW

  • Actual Power Factor: 0.75 (below 0.85 threshold)

  • \(Billed\ Demand = 500\ kW \times \frac{0.85}{0.75} = 566.67\ kW\)

  • Result: The customer is charged for 566.67 kW instead of 500 kW, increasing demand charges.


Why Does SCE Do This?

  • Grid Efficiency: Low power factor increases reactive power (kVAR), requiring utilities to supply more current for the same real power (kW). This strains transformers, lines, and other infrastructure.

  • Cost Recovery: Penalties help offset the utility’s costs to handle inefficient loads.


How Businesses Can Avoid Penalties

1. Power Factor Correction

  • Install capacitor banks or synchronous condensers to offset reactive power.

  • Target a power factor of 0.95 or higher to avoid adjustments.

2. Monitor Power Factor

  • Use meters to track power factor in real time.

  • SCE’s SmartConnect™ meters provide detailed data for analysis.

3. Load Management

  • Avoid simultaneous operation of inductive loads (e.g., motors, transformers) without correction.


SCE Rate Schedules with Power Factor Clauses

Rate PlanPower Factor AdjustmentTypical Users
GS-2/GS-3Applies if power factor < 0.85Medium/large commercial facilities
INDApplies if power factor < 0.90 (varies by plan)Industrial plants, factories

Conclusion

SCE penalizes business customers with poor power factor on select rate plans to incentivize efficient energy use. By maintaining a power factor above 0.85 (or higher, depending on the plan), businesses can avoid inflated demand charges.

Proactive measures like capacitor installation and load management are key to minimizing costs. For specifics, consult SCE’s tariff documents or contact their business customer service.

2. Voltage

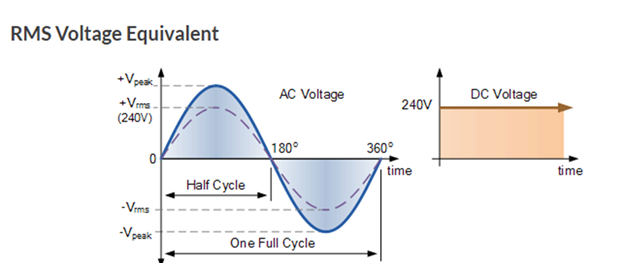
VRMS (Root Mean Square Voltage)

  1. It’s the effective or equivalent DC voltage of an AC signal.
  2. Represents the value of voltage that delivers the same power as a DC voltage.
  3. Formula: \(V_{\text{RMS}} = \frac{V_{\text{peak}}}{\sqrt{2}}\) for sinusoidal AC.
  4. Used in power calculations for AC circuits to simplify real power measurements.

Example

3. Current

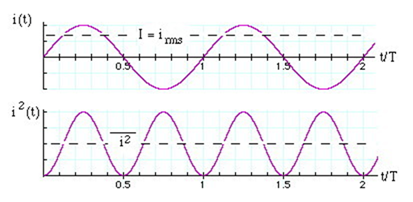
IRMS (Root Mean Square Current)

  1. It’s the effective current value of an AC signal.
  2. Represents the equivalent DC current that would produce the same heating effect in a resistor.
  3. Formula: \(I_{\text{RMS}} = \frac{I_{\text{peak}}}{\sqrt{2}}\) for sinusoidal AC.
  4. Key for calculating power consumption in AC circuits.

These values help in understanding and calculating real power in AC circuits, which fluctuate over time but can be represented with RMS for practical purposes.

IRMS 

4. Temp

TEMP ( F/C)

The measured room Temperature in Fahrenheit / Centigrade.

5/6. Active Interval Energy FR (kWh)

Active Energy Forward and Reverse on Electricity Utility Bills: Explained

In the context of an electricity utility bill, the terms Active Energy Forward and Active Energy Reverse refer to two directions of energy flow measured by your electricity meter. These terms are common in regions or billing systems where consumers can both consume energy from the grid and export energy back to the grid (e.g., via solar panels or other distributed generation). Here’s what they mean:

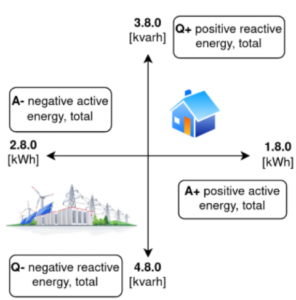
Example of Active and Reactive Forward and Reverse energy

  • What is Active Power? 
    • Active power (P) is the portion of electrical power that performs useful work, such as lighting, running motors, or powering electronic devices.
    • It is measured in watts (W) or kilowatts (kW).
    • Active power is the power that is actually consumed by the load

1. Active Energy Forward

  • Definition: The total energy consumed (imported) from the grid by your household or business, measured in kilowatt-hours (kWh).
  • What it Means: This is the electricity you draw from the utility company to power your appliances, lights, etc.
  • Billing Impact: This is the energy you are charged for on your bill (unless offset by exported energy). In short, active energy is the energy actually converted into work or heat by an electrical device.

2. Active Energy Reverse

  • Definition: The total energy exported (fed back) into the grid from your system (e.g., solar panels, batteries, or generators), also measured in kWh.
  • What it Means: If you generate more electricity than you use (e.g., during sunny days with solar panels), the excess flows back to the grid.
  • Billing Impact: Depending on your utility’s policy, this energy may be:
    • Credited against your consumption (net metering).
    • Paid at a feed-in tariff rate (if applicable).
    • Tracked separately for accounting purposes.

Key Differences

TermActive Energy ForwardActive Energy Reverse
DirectionEnergy imported from the grid.Energy exported to the grid.
SourceUtility company supplies you.Your system (solar, etc.) supplies grid.
Billing RoleYou pay for this energy.You earn credits or reduce charges.

Why This Matters

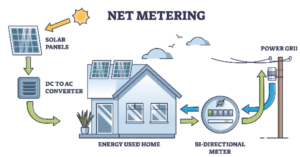
  • Net Metering: If your utility offers net metering, your bill will calculate Net Energy = (Forward – Reverse). You only pay for the net consumption.
    • Example: If you use 500 kWh (Forward) and export 300 kWh (Reverse), you pay for 200 kWh.
  • Solar/Battery Users: Reverse energy is critical for calculating savings or earnings from solar panels.
  • Time-of-Use (TOU): Some utilities apply different rates to Forward and Reverse energy based on time periods.

Example on a Bill

A typical bill might show:

  • Active Energy Forward (Import): 600 kWh × $0.15/kWh = $90.00
  • Active Energy Reverse (Export): 400 kWh × $0.10/kWh (feed-in tariff) = -$40.00
  • Total Due: $90.00 – $40.00 = $50.00

Note

  • Terms may vary by region or utility. Some bills use labels like “Delivered” (Forward) and “Received” (Reverse), or “Consumption” vs. “Generation”.
  • Reactive Energy (kVARh) is a separate concept related to power quality and is rarely included on residential bills.

If you have solar panels or a bidirectional meter, these terms are essential for understanding how your energy exports reduce your bill or generate income. Check your utility’s rate plan for specifics!

8. Active Demand Power

In the Context of an Electricity Utility Bill

“Active Demand Power” (often called “Demand Charge” or “Maximum Demand”) refers to a billing component tied to the peak rate of electricity consumption (measured in kilowatts, kW) over a specific period. Unlike energy charges (based on total energy used, measured in kWh), demand charges reflect the maximum power drawn from the grid at any point, which impacts the utility’s infrastructure costs.


Key Concepts

1. What is “Active Demand Power”?

  • Definition: The highest average power (kW) your facility draws from the grid during a billing cycle, typically measured over 15- or 30-minute intervals.

  • Purpose: Utilities charge for demand to recover costs associated with maintaining grid infrastructure (e.g., transformers, lines) capable of meeting your peak power needs.

2. How It’s Measured

  • Utilities use demand meters to record your power usage in short intervals (e.g., every 15 minutes). The highest average value in these intervals becomes your “peak demand” for the billing period.

  • Example: If your facility draws 100 kW for 15 minutes, your demand for that interval is 100 kW. If this is the highest value during the month, it becomes your billed demand.

3. Billing Impact

  • Demand charges are separate from energy charges (kWh).

  • Formula: Demand Charge = Peak Demand (kW) × Rate ($/kW).

  • Example: If your peak demand is 150 kW and the rate is $10/kW, your demand charge is $1,500 for the month.


Why Demand Charges Matter

  • Cost Driver: For commercial/industrial users, demand charges can account for 30–70% of the total bill, even if energy usage is low.

  • Grid Strain: High peaks strain the grid, requiring utilities to invest in infrastructure to handle maximum loads.

  • Efficiency Incentive: Reducing peak demand lowers costs and improves grid stability.


Active Demand Power vs. Energy Consumption

AspectActive Demand PowerEnergy Consumption
MeasurementPeak power (kW) over short intervals (15–30 min).Total energy used (kWh) over the month.
Billing FocusInfrastructure costs (capacity).Fuel/generation costs (usage).
Typical UsersCommercial, industrial, large facilities.Residential, small businesses.

Example on a Bill

A commercial customer’s bill might include:

  1. Energy Charge: 10,000 kWh × $0.12/kWh = $1,200

  2. Demand Charge: 200 kW (peak) × $15/kW = $3,000

  3. Total Bill: $1,200 + $3,000 = $4,200

Here, demand charges dominate the bill despite lower energy costs.


How to Reduce Demand Charges

  1. Load Shifting: Spread high-power equipment usage (e.g., HVAC, machinery) to avoid simultaneous operation.

  2. Energy Storage: Use batteries to discharge power during peaks.

  3. Demand Response: Participate in utility programs to reduce usage during grid-stress periods.

  4. Efficiency Upgrades: Install high-efficiency equipment to lower peak draws.


Special Notes

  • “Active” vs. “Reactive” Demand:

    • Active Demand (kW): Real power used to perform work (lights, motors).

    • Reactive Demand (kVAR): Power lost due to inefficiencies (e.g., motors, transformers). Some bills penalize high reactive power.

  • Time-of-Use (TOU) Demand: Rates may vary by time of day (e.g., higher demand charges during peak hours).


Who Needs to Care?

  • Commercial/Industrial Facilities: Factories, data centers, hospitals.

  • Large Buildings: Office towers, shopping malls.

  • EV Charging Stations: High-power loads can spike demand.

Understanding and managing active demand power is critical for reducing electricity costs and optimizing energy use in high-consumption settings. Check your utility’s tariff structure for specifics!

9. Reactive Energy L

Reactive Energy Inductive kvarh on a California Electricity Utility Bill

Reactive energy inductive kvarh on a California electricity utility bill refers to the measurement of inductive reactive power consumption over time. Here’s a structured explanation:


Key Concepts

1. Reactive Energy (kvarh)

  • Reactive Power (kVAR): Unlike real power (kW), which performs useful work, reactive power is used to maintain electromagnetic fields in inductive devices (e.g., motors, transformers). It does not contribute to actual energy consumption but is necessary for device operation.

  • Kilovar-hour (kvarh): The unit for cumulative reactive energy, calculated by integrating reactive power over time.

2. Inductive Loads

  • Devices like motors, pumps, and transformers require inductive reactive power to create magnetic fields. This causes a lag between voltage and current (low power factor).


Billing Context in California

  • Residential Customers: Typically not charged for reactive energy. Bills are based on real energy (kWh). Power factor issues are rare in homes due to lower inductive loads.

  • Commercial/Industrial Customers: Often subject to power factor penalties or reactive energy charges if their power factor falls below a utility-defined threshold (e.g., 0.9). This is because low power factor increases grid strain and inefficiencies.


Utility Practices in California

1. Measurement

  • Utilities measure both real energy (kWh) and reactive energy (kvarh). Power factor (PF) is calculated as:

  • If PF < 0.9, charges may apply.

2. Charging Methods

  • Power Factor Adjustment: Demand charges (based on kW) may be multiplied by a penalty ratio (e.g., 0.9 / actual PF), increasing costs for low PF.

  • Direct kvarh Charges: Some tariffs bill excess reactive energy (kvarh) directly, though this is less common than PF adjustments.

3. Utility Examples

  • PG&E, SCE, SDG&E: Tariffs often include power factor clauses. For instance, PG&E’s Schedule A-10 for large customers applies a PF adjustment to demand charges.


Mitigation Strategies

  • Power Factor Correction: Installing capacitors offsets inductive reactive power, improving PF and avoiding penalties. This reduces kvarh drawn from the grid.


Summary

In California, inductive kvarh on a utility bill reflects reactive energy used by inductive loads. While residential users are generally exempt, commercial/industrial customers may face penalties for low power factor, either through adjusted demand charges or direct kvarh billing. Utilities incentivize efficient power use to enhance grid performance.

10. Reactive Energy C

In an electricity utility bill, Reactive Energy (Capacitive kVARh) refers to the component of electrical energy associated with capacitive reactive power in an alternating current (AC) system. Unlike active energy (kWh), which represents the “real” power used to perform work (e.g., lighting, heating, or running motors), reactive energy (kVARh) reflects the power required to maintain electromagnetic fields in capacitive or inductive equipment. Here’s a breakdown:


Key Concepts

1. Reactive Power (kVAR)

  • Definition: Power that oscillates between the grid and capacitive/inductive loads without being consumed.

  • Capacitive vs. Inductive:

    • Inductive reactive power (lagging): Drawn by motors, transformers, and inductive loads.

    • Capacitive reactive power (leading): Generated by capacitor banks, long transmission lines, or overcompensated systems.

2. Reactive Energy (kVARh)

  • Measured in kilovolt-ampere-reactive hours (kVARh).

  • Represents the total capacitive or inductive reactive energy consumed/generated over time.

3. Why It Matters

  • Reactive power increases losses in the grid and reduces efficiency.

  • Utilities often penalize excessive reactive energy to incentivize power factor correction (PFC).


Capacitive kVARh on Your Bill

1. Capacitive Reactive Energy

  • Occurs when a system generates leading reactive power (e.g., due to overcompensation with capacitors).

  • Unlike inductive reactive power (common in industrial settings), capacitive reactive power is less frequent but can destabilize the grid if unmanaged.

2. Billing Implications

  • Penalties: Utilities may charge for capacitive kVARh if it exceeds a threshold (e.g., a power factor < 0.9 leading or > 0.9 lagging).

  • Power Factor (PF):

    • PF = Active Power (kW) / Apparent Power (kVA).

    • A low power factor (due to high reactive energy) increases infrastructure strain and costs.


Example on a Bill

A utility bill might show:

  • Active Energy (kWh): 10,000 kWh × $0.12/kWh = $1,200

  • Reactive Energy (Capacitive kVARh): 2,000 kVARh × $0.03/kVARh = $60 (penalty)

  • Total Charges: $1,200 + $60 = $1,260


Why Capacitive kVARh is Penalized

  1. Grid Instability: Leading capacitive power can cause voltage spikes, damaging equipment.

  2. Overcompensation: Excess capacitors (installed to correct inductive lagging PF) can overshoot, creating a leading PF.

  3. Utility Costs: Managing capacitive reactive energy requires additional infrastructure (e.g., reactors).


How to Avoid Penalties

1. Power Factor Correction (PFC)

  • Use capacitor banks (for inductive loads) or reactors (for capacitive loads) to balance reactive power.

  • Aim for a power factor close to 1.0 (ideal) or within the utility’s acceptable range (e.g., 0.95–1.0).

2. Monitor Reactive Energy

  • Install power factor meters or energy management systems.

3. Adjust Capacitor Banks

  • Automatically switch capacitors on/off based on real-time load conditions.


Capacitive vs. Inductive Reactive Energy

FeatureCapacitive kVARhInductive kVARh
CauseOvercompensation with capacitors, solar inverters, or long cables.Motors, transformers, inductive loads.
Power FactorLeading (current leads voltage).Lagging (current lags voltage).
Utility ImpactVoltage rise, instability.Voltage drop, inefficiency.
SolutionAdd inductive reactors or reduce capacitors.Add capacitor banks.

Who Needs to Care?

  • Industrial Facilities: Factories with heavy machinery.

  • Commercial Buildings: Large HVAC systems or data centers.

  • Solar/Wind Farms: Inverters can generate capacitive reactive power.


Key Takeaway

Capacitive kVARh on your bill signals an imbalance in reactive power, often from overusing capacitors. Utilities penalize this to ensure grid stability and efficiency. By managing your power factor (e.g., adjusting capacitor banks), you can avoid these charges and optimize energy use. Always check your utility’s power factor thresholds and tariffs!

11. Reactive Power

Reactive Power (kVAR) on an Electric Utility Bill

Reactive power (kVAR) can appear as positive or negative values on an electric utility bill due to the direction of reactive power flow in the system. This distinction reflects whether the reactive power is inductive (lagging) or capacitive (leading), which has implications for grid stability and billing. Here’s a detailed explanation:


1. Why Reactive Power (kVAR) Can Be Positive or Negative

  • Inductive (Positive kVAR):

    • Caused by inductive loads (e.g., motors, transformers) that require reactive power to create magnetic fields.

    • Current lags voltage (lagging power factor).

    • Utilities often designate inductive reactive power as positive (+kVAR).

  • Capacitive (Negative kVAR):

    • Caused by capacitive loads (e.g., capacitors, underground cables) that generate reactive power.

    • Current leads voltage (leading power factor).

    • Utilities often designate capacitive reactive power as negative (-kVAR).


2. How Utilities Use This Information

Grid Impact
  • Inductive (Positive kVAR):

    • Drains reactive power from the grid, causing voltage drops and increased line losses.

  • Capacitive (Negative kVAR):

    • Injects reactive power into the grid, potentially causing overvoltage or resonance issues.

    • Utilities monitor both to maintain voltage stability and prevent equipment damage.

Billing Context
  • Power Factor (PF) Penalties:

    • Most utilities penalize customers for low power factor (PF < 0.9–0.95), regardless of whether it’s inductive or capacitive.

    • PF is calculated as:

      \(
      \text{PF} = \frac{\text{Real Power (kW)}}{\sqrt{\text{(kW)}^2 + \text{(kVAR)}^2}}
      \)

    • Low PF (from either +kVAR or -kVAR) increases grid strain, so utilities charge penalties.

  • Net vs. Absolute kVAR:

    • Some tariffs charge for net reactive energy (algebraic sum of +kVARh and -kVARh).

    • Others penalize total reactive energy (absolute value of kVARh) to discourage both over-inductive and over-capacitive loads.


3. Why Negative kVAR Appears on Bills

  • Overcompensation:

    • Installing too many power factor correction capacitors can shift the system from lagging (inductive) to leading (capacitive), resulting in negative kVAR.

  • Capacitive Loads:

    • Facilities with significant capacitor banks or underground cables may naturally generate capacitive reactive power.


4. Utility Billing Practices

  • Residential Customers:

    • Rarely billed for reactive power, as their loads are mostly resistive (e.g., lights, appliances).

  • Commercial/Industrial Customers:

    • Charged if PF falls below a threshold (e.g., 0.9). For example:

      • PG&E (California): Adjusts demand charges based on PF.

      • SCE (Southern California Edison): Penalizes both inductive and capacitive low PF.

  • Sign Conventions in Bills:

    • +kVARh = Inductive reactive energy consumed (needs correction via capacitors).

    • -kVARh = Capacitive reactive energy generated (may require reducing capacitors).


5. Key Takeaways

  • Positive kVAR: Inductive loads (lagging PF) → Utilities penalize to encourage power factor correction.

  • Negative kVAR: Capacitive loads (leading PF) → Can also trigger penalties if PF is too low.

  • Billing Focus: Most utilities care about magnitude of PF deviation, not the direction. Both +kVAR and -kVAR can lead to charges if PF is outside the allowed range.


Example Scenario

A factory with motors (inductive) might install capacitors to improve PF. If overdone:

  • Net kVARh becomes negative (capacitive).

  • Result: The utility may still penalize if PF < 0.95, even though the system is now leading.


In summary, ±kVAR values reflect the type of reactive power flow, but billing penalties typically depend on the power factor, not the direction. Utilities track both to manage grid health, but customers are incentivized to maintain a PF close to unity (1.0), regardless of inductive or capacitive behavior.

12. Reactive Demand Power

In Southern California Edison (SCE) utility bills, reactive demand power (kVAR) values are typically based on 15-minute interval measurements, similar to real power (kW) demand. Here’s a detailed explanation:


1. Demand Measurement in SCE Tariffs

  • 15-Minute Averaging:

    • SCE, like most utilities, measures demand (both real [kW] and reactive [kVAR]) by calculating the average power over consecutive 15-minute intervals during the billing period.

    • The highest average reactive demand (kVAR) in any 15-minute window is often used for billing or power factor calculations.

  • Purpose:

    • This interval-based approach ensures fairness and accuracy, as it captures short-term peaks in reactive power consumption that strain grid infrastructure.


2. How Reactive Demand Applies to Billing

  • Power Factor Penalties:

    • SCE penalizes customers if their power factor (PF) falls below a threshold (e.g., 0.85–0.95).

    • PF is calculated using both real demand (kW) and reactive demand (kVAR):

      \(
      PF = \frac{kW}{\sqrt{kW^2 + kVAR^2}}
      \)

    • Low PF (from high kVAR) triggers adjustments to demand charges.

  • Demand Charge Components:

    • Some SCE tariffs (e.g., TOU-8, GS-2) may itemize reactive demand (kVAR) or bundle it into apparent power (kVA) charges.

    • For example, if your peak 15-minute kVAR is high, your kVA (and thus demand charges) increases even if real power (kW) stays the same.


3. Why 15-Minute Intervals Matter

  • Grid Stability:

    • Short-term reactive power spikes (e.g., from motors starting) can destabilize voltage.

    • 15-minute averaging smooths transient spikes while capturing sustained inefficiencies.

  • Customer Behavior:

    • Facilities must manage reactive power continuously, not just at peak times.

    • Capacitor banks or static VAR compensators (SVCs) are often timed to offset kVAR within each interval.


4. How to Verify This on Your SCE Bill

  • Demand Data:

    • Check the “Demand” section of your bill. SCE may list:

      • Peak kW Demand: Highest 15-minute average real power.

      • Peak kVAR Demand: Highest 15-minute average reactive power (if explicitly measured).

      • kVA Demand: Calculated from kW and kVAR peaks (if PF penalties apply).

  • Tariff-Specific Rules:

    • Review your rate schedule (e.g., TOU-8, GS-2) in SCE’s tariff book for exact definitions.

    • For example:

      • TOU-8 uses kVA demand for billing, derived from 15-minute kW and kVAR averages.


5. Mitigation Strategies

  • Power Factor Correction:

    • Install capacitors to offset inductive kVAR, ensuring PF stays above SCE’s threshold (e.g., 0.95).

  • Load Monitoring:

    • Use energy management systems to track 15-minute kW/kVAR trends and avoid reactive demand spikes.


Key Takeaway

Yes, reactive demand (kVAR) on SCE bills reflects the highest 15-minute average reactive power during the billing period. This interval-based measurement ensures customers are charged for sustained inefficiencies, incentivizing power factor correction to reduce grid strain and avoid penalties. Always consult your specific SCE tariff for exact billing rules.

7. Demand Charges

Demand charges are a critical component of SCE utility bills, particularly for business customers. Here’s a structured breakdown to clarify how they work and their impact:

1. What Are Demand Charges?

  • Definition: Demand charges are fees based on the highest rate of electricity usage (measured in kilowatts, kW) during a billing period, rather than total energy consumed (kilowatt-hours, kWh).
  • Purpose: They cover the utility’s costs to maintain infrastructure capable of handling peak power demands, ensuring reliability during high-usage periods.

2. How SCE Calculates Demand Charges

  • Measurement Window: SCE typically measures the highest average power usage over a 15-minute or 30-minute interval during the billing cycle.
  • Rate Structure: The peak demand (in kW) is multiplied by a demand rate (e.g., $15/kW), which varies by rate plan and time of day.
  • Example: If a factory’s peak demand is 200 kW during a 15-minute window, and the demand rate is $20/kW, the charge would be 200 kW × $20 = $4,000 for that month.
  • Understanding SEC Utility Bill [Read more…]
  • Example of  Demand Charges [Read more…]
  • Lorawan Report [Read more…]
  • Understanding Electricity Bill [Read more…]
  • Smart Metering [Read more…]

3. Key Factors Influencing Demand Charges

  • Rate Plans:
    • Time-of-Use (TOU) Plans: Demand charges may differ for on-peak (e.g., 4–9 PM) and off-peak periods. On-peak demand is often charged at higher rates.
    • General Service (GS) Plans: Common for businesses, these include demand charges based on monthly peaks.
  • Seasonal Variations: Summer months often have higher demand rates due to increased grid strain from air conditioning.

4. Why Demand Charges Matter for Businesses

  • Cost Impact: Demand charges can account for 30–70% of a business’s electricity bill, sometimes exceeding energy usage costs.
  • Peak Penalties: A single spike in usage (e.g., starting heavy machinery) can lead to significantly higher charges for the entire billing cycle.

5. Strategies to Reduce Demand Charges

  • Load Shifting: Stagger the use of high-power equipment to avoid simultaneous operation.
  • Energy Storage: Use batteries to supply power during peak periods, reducing grid reliance.
  • Demand Response Programs: Participate in SCE incentives to reduce usage during grid emergencies or peak times.
  • Efficiency Upgrades: Install energy-efficient motors, HVAC systems, or LED lighting to lower overall power needs.

6. Common Misconceptions

  • kW vs. kWh:
    • kW (Demand): The “speed” of energy use (like how fast you drive).
    • kWh (Energy): The total “distance” traveled (total energy consumed).
  • Monthly vs. Annual Peaks: SCE bills demand charges based on monthly peaks, not annual averages.

7. Example Scenario

A retail store operates on SCE’s TOU-D-T rate plan:

  • On-Peak Demand Rate: $25/kW (4–9 PM weekdays).
  • Off-Peak Demand Rate: $10/kW (all other times).
  • If the store’s peak demand is 100 kW during on-peak hours, the demand charge would be 100 kW × $25 = $2,500.
  • If they reduce their peak to 80 kW by shifting some operations to off-peak hours, the charge drops to 80 kW × $25 = $2,000, saving $500.

8. Tools and Resources

  • SCE’s Online Portal: Track real-time usage and demand via My Account.
  • Rate Guides: Review SCE’s business rate schedules (e.g., GS-2, TOU-8) for specific demand charge details.
  • Energy Audits: SCE offers audits to identify peak demand reduction opportunities.

Conclusion

Demand charges incentivize businesses to manage their electricity usage efficiently, reducing strain on the grid and lowering costs. By understanding peak demand patterns and adopting strategies like load shifting or energy storage, businesses can significantly reduce their SCE bills. For tailored advice, consult SCE’s business customer service or an energy management professional.